In the past several years, global wheat markets have been productive. Really productive. Partly this was triggered by higher plantings in response to higher prices in 2011 and 2012 and partly due to favorable production conditions in the past several years. At the same time, global wheat demand stagnated and world inventories have risen to historical highs. As such, wheat prices have tumbled, both in absolute terms (relative to the average in the past decade) and relative to prices of other crops.
The natural question, of course, is will wheat prices rise? As the adage goes, the remedy to low prices is low prices. Most economists will agree that as the price of a commodity decreases, producers will typically reduce their production of that commodity, which would eventually nudge the market price upward. But, as I’ve discussed in the past, sometimes even producers’ best intentions may go awry. For example, last year, U.S. producers significantly reduced wheat plantings, but favorable weather conditions that led to higher yields ultimately resulted in unexpectedly large production.
If you’re a sports fan, you’ve probably somewhat a believer in the “due” principle. You know, a baseball player who strikes out 10 times in a row is “due” for a hit. Or a hockey goalie who’s made 40 saves in a row is “due” to let a puck in. So, is global wheat production “due” for a supply crash?
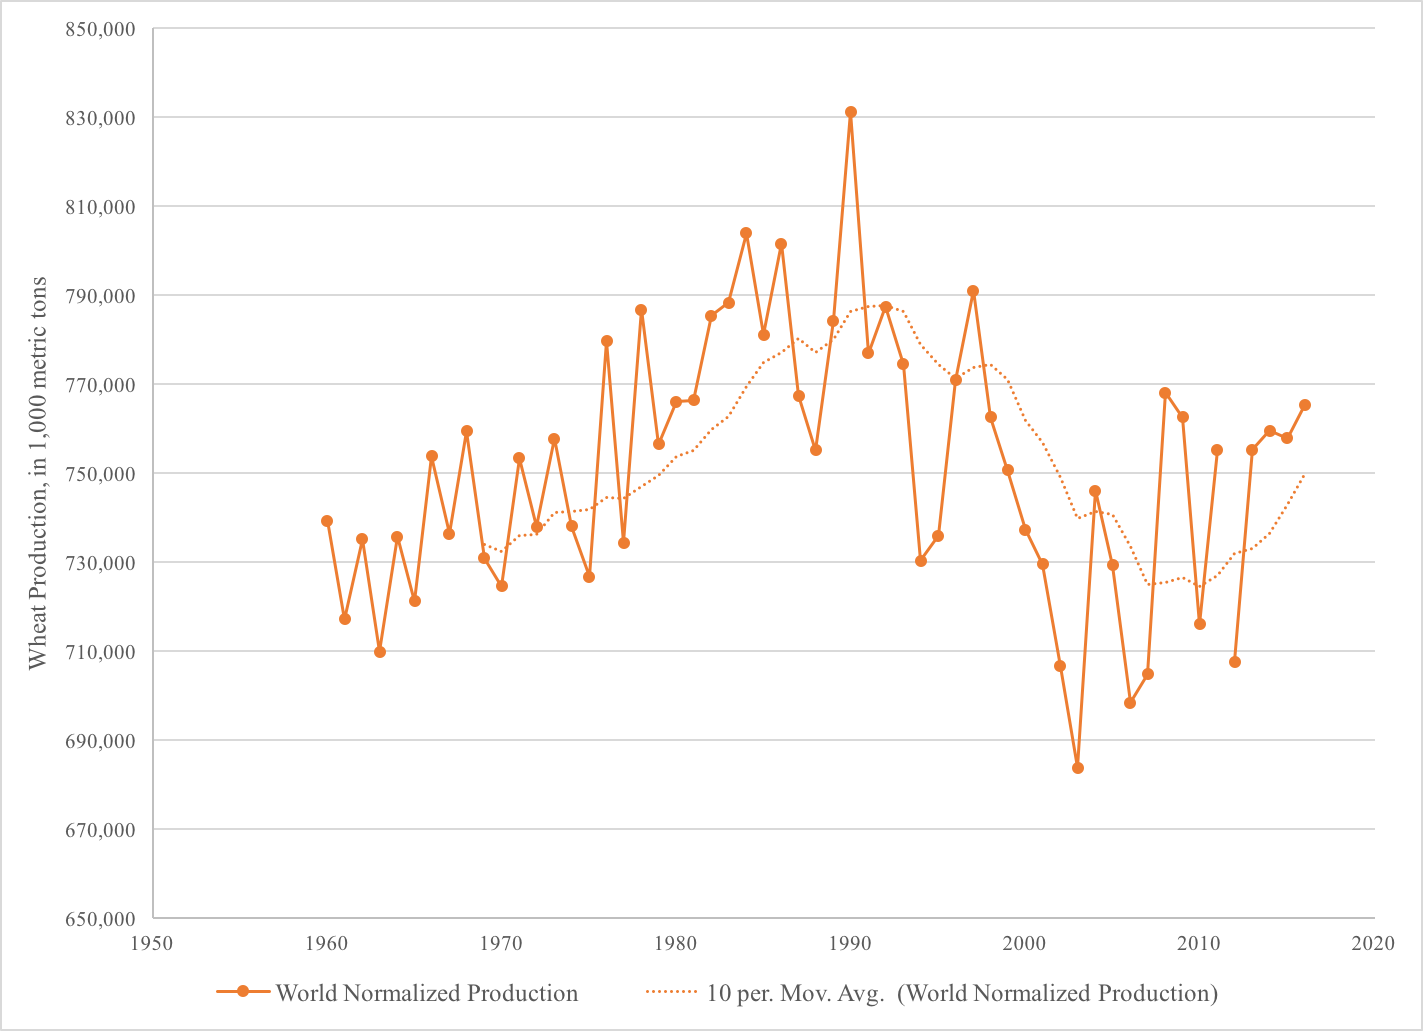
I looked into historical global wheat production data between 1960 and 2016 available in the USDA Foreign Agricultural Service’s Production, Supply, and Distribution database. Then, I detrended these data to ensure that the analysis wasn’t biased by the fact that wheat production has increased simply because of technological advances. That is, I wanted to account for the fact that the efficiency of inputs into wheat production in 2016 was quite different than input efficiency in 1960. In other words, I “normalized” the historical data in order to make meaningful comparisons across time.
Using the normalized wheat production data, I calculated a 10-year moving average (i.e., for each year, what was the average production in the ten preceding years) and noted for which years production was above the 10-year moving average. Here’s what those normalized production data (in 1,000 metric tons) and the 10-year moving average look like. The figure makes evident that in the past four years, world production has been above the average production in the preceding 10 years.
So, what are the chances that after seeing four straight years of above-average production, we’ll see a fifth above-average year? Here’s what the data indicate:
| Probability of… | |||
| 4 consecutive above-average production years | 5 consecutive above-average production years | 6 consecutive above-average production years | |
| World wheat output | 15.38% | 13.16% | 10.81% |
The empirical probability analysis indicate that, historically, there’s only approximately an 13% chance that we would observe five consecutive years of above-average production. Conversely, there appears to be an 87% chance that world wheat markets will see production dip below the 10-year moving average.
Will this result in an immediate upward price response? Probably not, given the historically high global wheat inventories. But it potentially does mean that further wheat price drops are not likely.
(Photo by Starr Environmental is licensed under CC BY 4.0)


