Key insights:
- Barley prices have increased after several years of downward trends.
- Malt barley spot prices are currently forecasted to be between $4.15 and $5.15 per bushel in 2017/18 and may rise by 6–20% in 2018/19.
- Upward price pressure is being currently driven by lower global supplies and significant drops in both U.S. and global stocks-to-use ratios.
- Markets still value hard red winter slightly more than malt barley, but barley has recently strengthened.
- Barley and oil seed crops are currently valued approximately on par with then ten-year average valuation.
- Barley production costs are expected to remain relatively the same as in 2017.
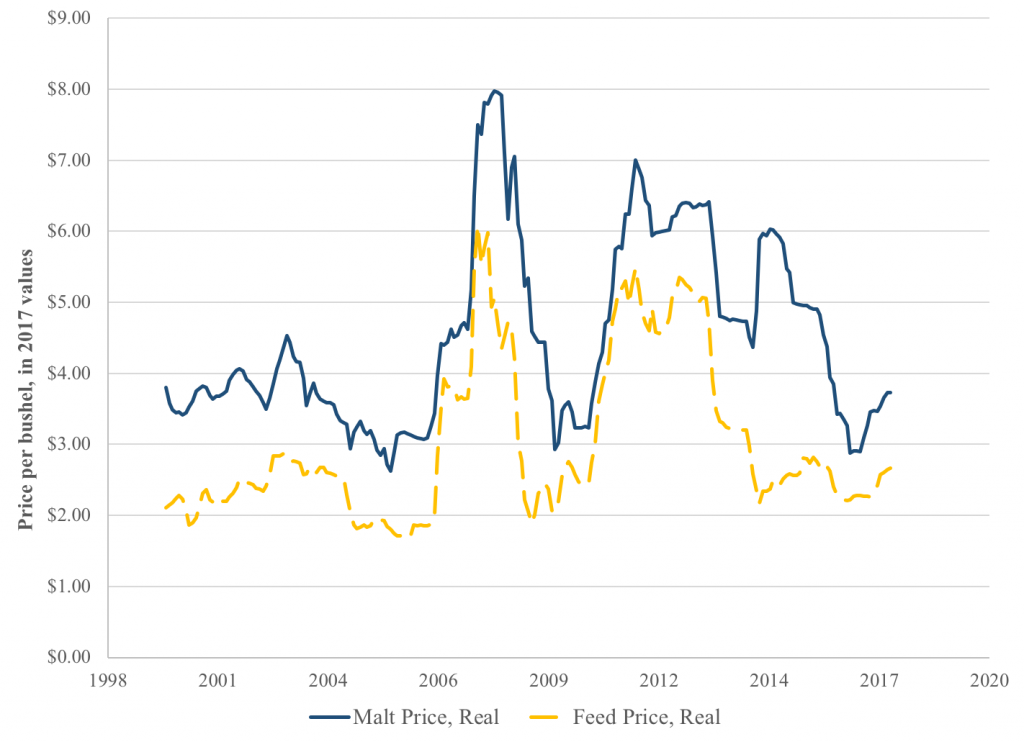
Northern U.S. barley markets are finally providing some signals of strength after several years of declines. This should be welcome news for many producers who have experienced declining returns and cuts to their malt barley contracts. The figure below shows the extent to which the northern U.S. barley market weakened relative to the past twenty years.
Figure notes: Data from the USDA Agricultural Marketing Service. Prices represent average barley spot market bids in Montana.
Several recent forecasts for barley prices—shown in the table below—similarly reflect the strengthening state of the barley market. The most recent estimates from the August 2017 Food and Agricultural Policy Research Institute (FAPRI), January 2018 Agri-food Canada (Ag-Can), and February 2018 USDA World Agricultural Supply and Demand Estimates (USDA) reports show that malt barley spot prices for the remainder of the 2017/18 marketing year are expected to be between $4.15 and $5.15 per bushel. For the 2018/19 marketing year, both FAPRI and Agri-food Canada project further price increases.
| Marketing year | FAPRI | USDA | Ag-Can |
| 2017/18 | $5.15 | $4.15–$4.75 | $4.56 |
| 2018/19 | $5.29 | $5.93 | |
| 2019/20 | $5.39 | $5.67 |
Table notes: Average feed grade discount in Montana between 2000 and 2017 has been 64.5%. FAPRI is the August 2017 FAPRI Baseline Update Report, and USDA is the February 2018 USDA World Agricultural Supply and Demand Estimates, Ag-Can is Agri-Food Canada January 2018 Outlook for Principal Field Crops report.
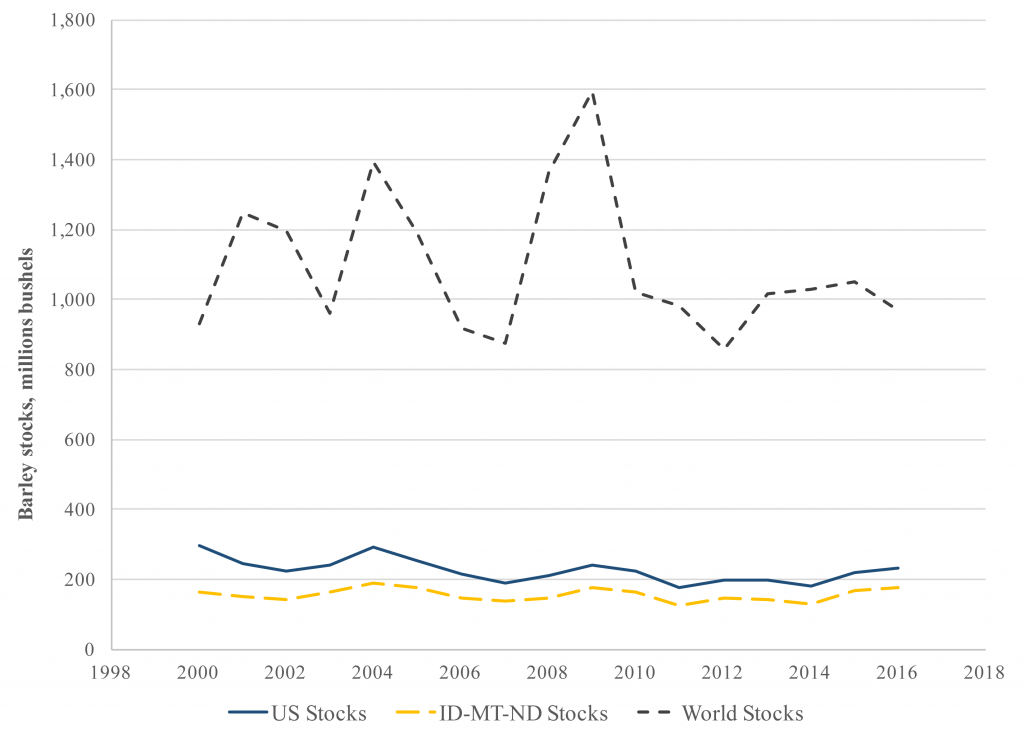
The cause of the price increases could be a result of tightening supplies, increases in demand, or both. Recent barley inventory and consumption data suggests that both forces may be at play. The first figure below shows while U.S. and regional (Idaho, Montana, and North Dakota) barley stocks have risen (as a result of several recent favorable production years), global barley inventories have remained at relatively constant followed by a dip last year.
 Figure notes: Data from the USDA National Agricultural Statistical Service and the Economic Research Service.
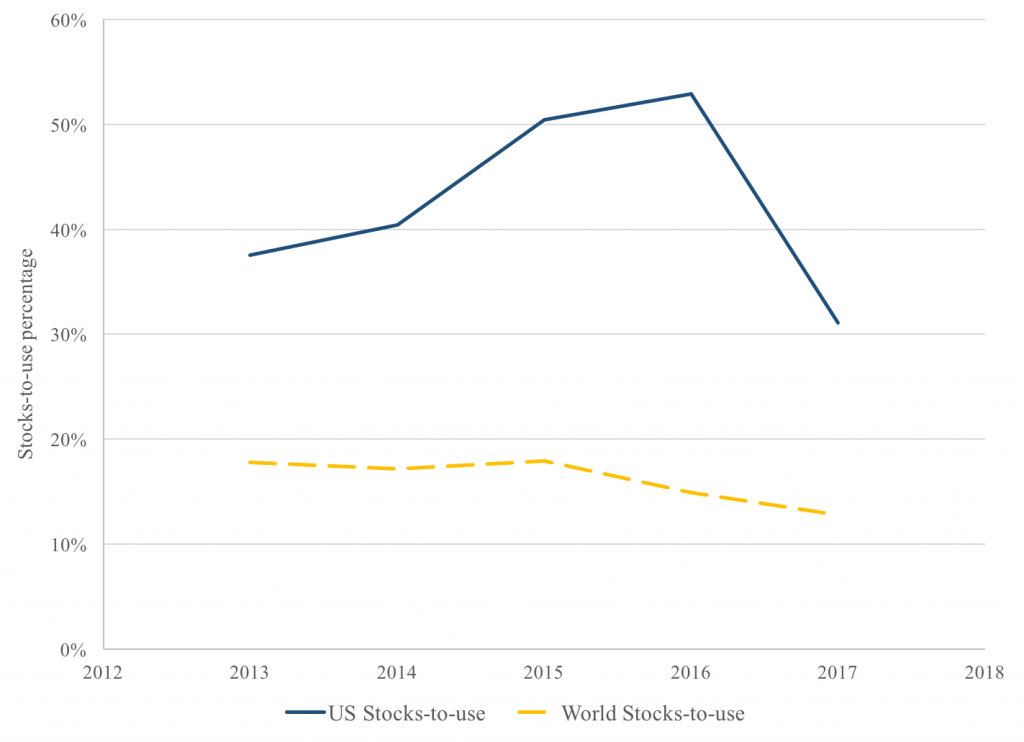
Perhaps more telling is the stocks-to-use ratio graph below. The stocks-to-use ratio considers the relative relationship between available inventories and consumption. Decreases in the stocks-to-use ratio typically indicate faster consumption relative to inventory replenishment, while increase indicate that grain production is outpacing use. In the United States, the stocks-to-use ratio increased in every year between 2013 and 2016, before taking a 21 percentage point drop (a 40% reduction in the stocks-to-use ratio) in 2017. Although not as dramatic, the global barley stocks-to-use ratio also fell in 2017. The combination of falling global barley stocks and stocks-to-use ratio suggests that both lower availability and higher use are contributing to upward price pressure.
Figure notes: Data from the USDA Economic Research Service.
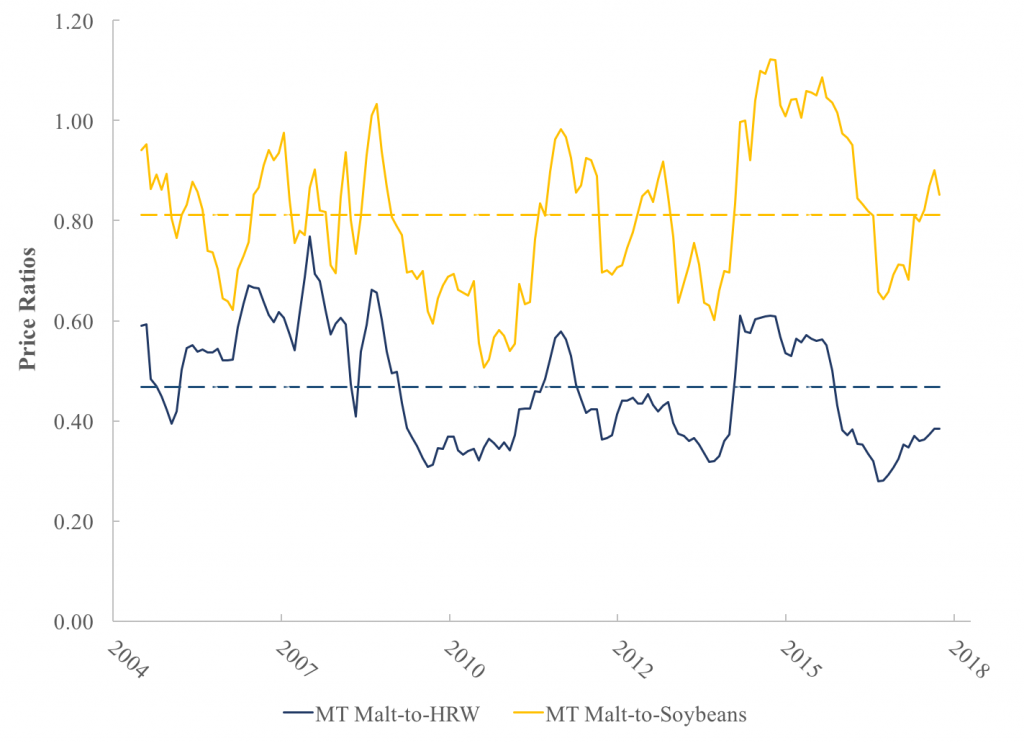
Another market signal that can be used to evaluate the extent to which markets value barley relative to other crops is the price ratio. Crops in northern U.S. dryland and irrigated rotations are (most commonly) winter wheat and (increasingly) canola. The graph below shows ratios of malt barley price to futures prices of hard red winter wheat (HRW) and soybeans. (While canola futures prices would provide a more accurate comparison, canola futures contracts do not exist. However, because both canola and soybeans are oil seed crops, their prices have historically been highly correlated; as such, soybean futures prices provide a reasonable approximation to market expectations for canola markets.) Relative to the ten-year average, recent price ratios trends indicate continued strengthening of markets’ valuation of barley relative to winter wheat. However, the barley-to-oil seed price ratio suggests that the relative valuation of those two crops is currently right around the ten-year average.
Figure notes: Dashed horizontal lines represent ten-year averages.
Lastly, it is important to consider whether the improvements in barley prices have also had parallel increases in barley production costs. Malt barley cost estimates from North Dakota State University indicate that 2018 production costs are expected to be approximately $200 per acre. These costs are nearly identical to those estimated for 2017, suggesting that most operations are likely to also experience similar expenditures in 2018 relative to those in 2017.
| Costs per acre | |||
| Region | Direct | Indirect | Total |
| N. Dakota, Northwest region | $132.28 | $74.62 | $206.90 |
| N. Dakota, Southwest region | $118.64 | $76.33 | $194.97 |
Table notes: NDSU Projected 2018 Crop Budgets for the Northwest and Southwest agricultural statistical regions. Total costs are approximately 1.4% in 2018 projected budgets than those in 2017 projected budgets.
What factors do you consider important in evaluating upcoming barley markets?
(Photo by Mustafa Khayat is licensed under CC BY 4.0)


