In 2014, the Whole Farm Revenue Protection (WFRP) insurance product was introduced by the Risk Management Agency (RMA). This product was intended to replace Adjusted Gross Revenue (AGR) and AGR-lite and is an insurance product that is intended to provide a single insurance policy that can insure multiple commodities simultaneously. The RMA cites that this “insurance plan is tailored for any farm with up to $8.5 million in insured revenue, including farms with specialty or organic commodities (both crops and livestock), or marketing to local, regional, farm-identity preserved, specialty, or direct markets.” Now this this product enters into its fifth year, it is worth evaluating how this product is being used and whether it is being used by those it is intended for.
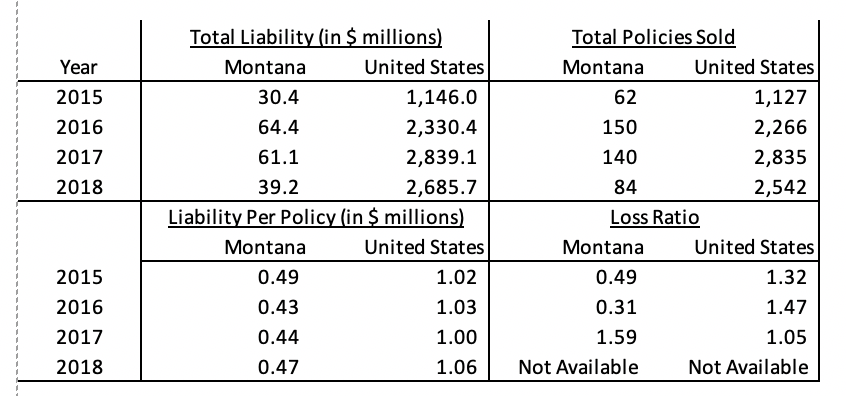
Two main variables that are useful when evaluating the usage of any crop insurance product includes the total insured liability and the number of policies sold. The table below shows that in 2018, the total liability for WFRP policies in Montana was $39.2 M, across 84 policies. This was down from $61.4 M in liability across 140 policies in 2017. This averages to just under $500k per policy, while nationally policies average over $1 m in liability. These values per policy have remained relatively constant across the last four years. Another notable indicator in crop insurance is the loss ratio, which is the amount of indemnities divided by the total premiums (including subsidies and farm-paid premiums). The RMA targets these rates to be around 1.00, but Montana was well-below below this targeted value in 2015 and 2016 and well-above it in 2017. The national average is typically well over the target. Indemnity information is not yet available for 2018, since indemnities are based on tax forms and are typically not available until well after the tax deadline on April 15. The total liability of $2.7 B of WFRP represents 2.6% of the total liability for the $110 B of the entire RMA portfolio across all insurance products. Also, the WFRP liability in Montana represents 1.5% of the national liability for that product.

Source: Risk Management Agency, Summary of Business
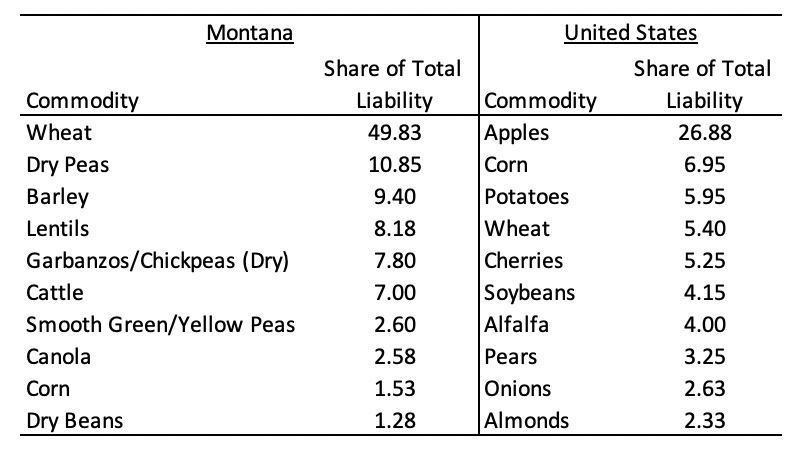
To examine the usefulness of WFRP to the targeted audiences, data were provided from the RMA that detailed the commodity breakdown and diversity counts for all WFRP policies. In what follows, we use this information to assess the uses of WFRP. First, commodity breakdowns are particularly important since WFRP is specifically targeted to diverse producers. In Montana, the total liability appears to be tilted towards crops already insured under single crop policies, including wheat, dry peas, barley, canola, corn, and dry beans. Each of these commodities are insured with individual crop policies at rates over 70% of total acreage and makes up 75% of the total WFRP liability for Montana. Other commodities that are not currently insurable or insured at very high levels, including lentils, garbanzos/chickpeas, and cattle, play a significant role in the total liability for WFRP. These products demonstrate a potential gain in the expansion of crop insurance to new and existing producers who likely would not be able to insure these crops without WFRP. It may be important for future outreach at MSU to focus on expanding WFRP insurance among these crops to new and beginning farmers.

Source: Risk Management Agency
In the United States, we see a similar story, though apples are clearly a dominant source of protection under WFRP. More than a quarter of the liability in the program traces back to apples, mostly in Washington. While we don’t have data on those individual contracts, these farmers are likely carrying a single commodity policy and using WFRP even though not receiving the full diversity discount.
Below is the final figure that displays a histogram of diversity counts for Montana and the United States. The large number of policies with 1 commodity are likely apple farmers in Washington. Other than that, we see the largest clustering of diversity counts around 2-4 crops in Montana, which includes 77 percent of all policies in Montana. The mean diversity count in Montana was 3.59. This is slightly higher than the national average of 3.02, which is likely reduced from the use of single commodity apple policies. It is also worth mentioning that there are policies with commodity counts higher than 9 nationally, but they only comprise 1.2 percent of all policies.

Source: Risk Management Agency
In the future, I plan to continue digging into the effectiveness and usefulness of WFRP in order to more effectively understanding how it can be better utilized and become more useful to those producers who currently do not have access to crop insurance. If you have any experience or opinions from using WFRP, I’d love to hear from you. Also, any follow-up questions are welcomed.
Note: This work is partially supported by the USDA National Institute of Food and Agriculture, Organic Agriculture Research & Education Initiative project #1004132. The contents are solely the responsibility of the author and do not necessarily represent the official views of the USDA or NIFA.


1 Comment
Nice work Eric… Jeff