The results of the 2017 USDA Ag Census were released last week. (Both Anton and Joel posted about some other highlights yesterday.) There has been good coverage in the media of some interesting nationwide trends, but I thought I’d use this week’s post to examine some Montana-specific items in particular. I’ve definitely spent too much time combing through interesting and, in some cases strange, numbers. You too can go down the rabbit hole of ag data here. Statistics reported are down to the county level, although not for all data items.
I have gotten a few questions lately about the importance of value-added agriculture to Montana. For the first time, the Ag Census attempts to answer some of these questions. If you want a quick outline of what value added agriculture is, this Choices article is a good place to start. Essentially, value-added products have undergone some change that adds to their value between the time of harvest and when they are sold. Processing fruit into jam is one example of added value. As ag operators look to diversify operations to offset some of the low-price trends we have seen in commodity markets, value-added products are one thing that is getting more attention. Many of the new producers we’ve seen in workshops over the last couple of years have been interested in or actively pursuing businesses plans that included value-added and/or direct-to-consumer aspects.
According to the Ag Census, Montana produces $9.2 million in value-added products, sells $9.8 million in direct-to-consumer sales, and $9.2 million in direct-to-retailers, institutions, and food hubs sales (There is some overlap between these categories). If any one of these categories were ranked alongside other commodity categories, they would fall at number 12—more than fruits, tree nuts, and berries, but less than horses, ponies, mules, burros, and donkeys. (All of these items are lumped together; I’m relatively certain burro sales are not a huge number in Montana).
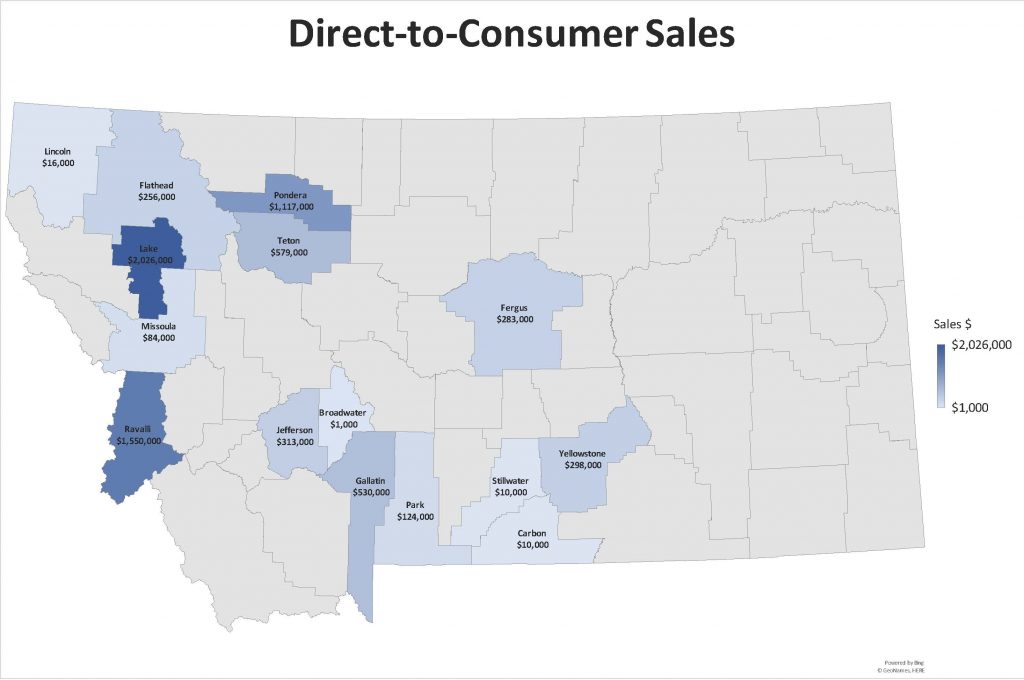
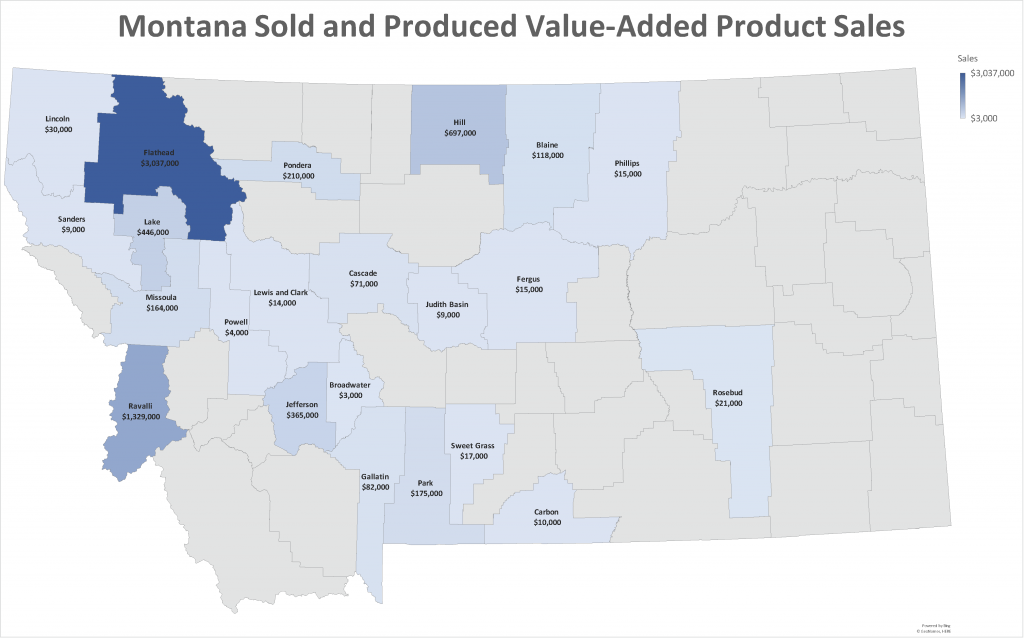
Where are these sales taking place? We’ve made maps showing sales by county. Value-added sales are much higher in the western part of the state than farther east, with Flathead and Ravalli counties reporting top sales by far—those two counties make up approximately half of the value-added sales for the entire state. Direct-to-consumer sales follow a similar pattern as the value-added; Lake, Ravalli, and Pondera counties reported the highest sales—together they represent over 65% of the states total sales.


Across the U.S., value-added product sales totaled just over $4 billion in 2017. Nationwide, direct-to-consumer sales were at $2.8 billion, more than doubling from 2012 when they were counted at $1.3 billion. An additional $9.0 billion in sales went directly to retailers, institutions, and food hubs for local or regionally branded products.
Are you a producer selling directly to consumers, retailers or other outlets and want to share your thoughts? Do you sell burros and want to correct me in saying they aren’t a major Montana commodity? Have you been combing through the Ag Census and have found some interesting or thought-provoking data points? I’d love to hear more, so please do send me a comment or email.
This post was written with assistance from DAEE M.S. Student Molly DelCurto.(Photo by Stephen Fulljames is licensed under CC BY 4.0)
