If Hamlet had been a farmer in 2019, perhaps he would also struggle with making the spring crop planting decision. In a previous post, I discussed the USDA’s 2019 Prospective Plantings report, which indicates that Montana farmers intended to significantly reduce lentil and chickpea acres, lower spring wheat plantings by about 10% (which would return spring wheat plantings to their approximate ten-year average), and, somewhat surprisingly, increase pea acreage. But is the pea acreage increase really a surprise?
One of my favorite tools to consider when thinking about planting decisions is the market signals sent by relative prices of different crops. For example, when the price of lentils is very high relative to the price of spring wheat, the value of planting lentils is also higher (and, thus, we are likely to see more lentil acres being planted). Similarly, in years when spring wheat prices are expected to be higher relative to the prices of other crops, land (a scarce commodity) is more likely to be allocated to wheat production.
In 2019, while pulse crop prices are down 30–50% from their ten-year average, spring wheat prices have also remained stagnant or decreased. As such, the decision to plant a pulse crop or a wheat crop is not so straightforward.
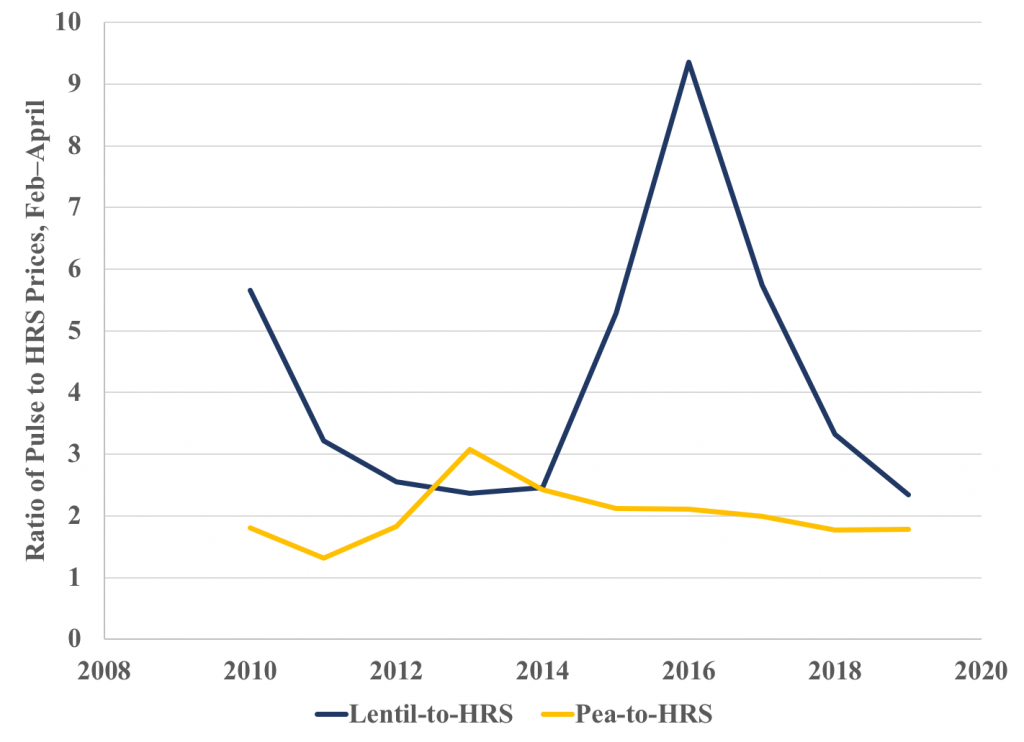
The graph and table below show the historical ratios of lentil-to-hard red spring wheat and pea-to-hard red spring wheat prices. For example, the lentil-to-HRS ratio is the price of lentils (per hundredweight) divided by the price of spring per bushel. A higher value of the ratio implies that lentil production would be more valuable relative to spring wheat production. A lower value implies that spring wheat may be more valuable. Additionally, the graph and table below represent the average ratios for each year that occurred between February and April, which is the time when producers are making their spring crop planting decisions.

| Year | Lentil-to-HRS | Pea-to-HRS |
| 2010 | 5.652 | 1.806 |
| 2011 | 3.216 | 1.313 |
| 2012 | 2.557 | 1.832 |
| 2013 | 2.371 | 3.073 |
| 2014 | 2.458 | 2.427 |
| 2015 | 5.282 | 2.117 |
| 2016 | 9.352 | 2.115 |
| 2017 | 5.742 | 1.991 |
| 2018 | 3.320 | 1.772 |
| 2019 | 2.338 | 1.779 |
The figure and table show that in the past ten years, spring 2019 represents the lowest lentil-to-HRS price ratio since 2010. That is, as of the information signaled by commodity markets in spring 2019, the relative value of lentils is at its lowest point in a decade. The highest lentil values occurred in 2016 and 2017, which are years when Montana (and United States) experienced the largest lentil plantings.
For peas, the story is slightly different. While the pea-to-HRS price ratio is low, it is approximately the same as it was last spring, and only slightly lower than two years ago. And it is certainly not as low as it was in 2011. This suggests that peas, relative to spring wheat, have held relatively comparable value going into the planting and production season. Perhaps this provides at least a partial explanation as to why the USDA Prospective Planting report showed a slight uptick in farmers’ consideration of planting peas.
What market and non-market factors drive your decisions to plant spring crops? To what extent to crop prices, agronomic practices, or other management considerations affect your choices?
(Photo by GRIMME Group is licensed under CC BY 4.0)

