USDA publishes “Rural America at a Glance” each year. I often find some interesting facts in this report. This year did not disappoint in terms of interesting tidbits. Not surprisingly, much of this year’s report highlighted COVID-19 related data.
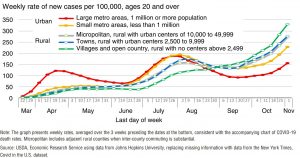
The first bit of data that caught my attention was the examination of COVID-19 deaths in rural and urban areas of the US.

In the spring of 2020 urban areas (specifically the large metro areas) had much higher death rates from COVID-19. New York City was the epic center of the spring outbreak. By July, the death rates for rural and urban areas had converged to very similar levels. After July, death rates have been higher in rural areas. The authors indicate some likely factors contributing to higher death rates in rural areas include: rural areas tend to have a higher percentage of older residents, rural areas tend to be farther from hospitals, residents of rural areas tend to have more underlying health issues and are less likely to have health insurance.
COVID in Montana’s Urban and Rural Counties
Since the start of the pandemic approximately 93,500 Montanans have tested positive for COVID-19. This is 8.75% of the overall population. There are many definitions of rural and urban but for this example, I am going to define the 7 counties (Gallatin, Yellowstone, Silver Bow, Cascade, Missoula, Flathead and Lewis and Clark) with a class AA school as urban. 64% of Montana’s population lives in these 7 counties while 36% live in Montana’s other 49 counties. The urban counties have experienced an 8.88% infection rate while the more rural counties have experienced 8.48% infection rate (as of January 29th). In urban areas, 93.6 deaths have occurred per 100,000 residents while in the less populous counties the death rate is 151.8 deaths per 100,000 residents.

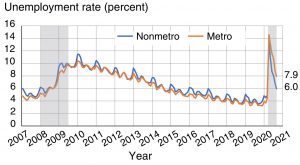
The unemployment rate was the second item to catch my attention in the report. Since the recession of 2008, non-metro areas have generally had higher unemployment rates than metro areas. The difference was not large but it was quite persistent over the past decade. Unemployment rates spiked for both metro and non-metro areas in March and April followed by significant reductions since then. However, unemployment rates (at the end of September) are still several full percentage points higher than 2019 levels. The unemployment rates in non-metro areas are now in the 6% range compared to nearly 8% for metro areas.
Much to my personal disappointment, it looks like Covid-19 will continue to have significant impacts on the US for at least a few more months. It will be very interesting to look back at the full data set once Covid-19 is in the rearview mirror.

