As the 2018 Farm Bill negotiations creep closer and closer, the usual discussions about the efficacy and efficiency of government programs that make it into the Farm Bill. In the 2014 Farm Bill, two new programs were introduced—Agricultural Risk Coverage (ARC) and Price Loss Coverage (PLC)—and they are likely to be topics of discussion.
The stated purpose of the ARC and PLC programs is to provide financial assistance to commodity crop producers during periods of market downturns and/or yield decreases. The ARC-County program is structured to provide assistance when county-area revenues drop below some trigger value and the PLC program makes payments when market year average prices fall below a reference price.
While the efficiency and cost-effectiveness of the specific program structures has been and continues to be debated, little has been said about whether these programs equally benefit farmers across the farm income distribution. When market downturns occur, small and medium-sized farms are arguably more vulnerable to these instabilities. How have ARC and PLC program payments been allocated to these farms, especially in relation to program allocations to larger farms that may have greater resource to sustain market volatilities?
To begin answering these types of questions, I used responses from the farm-level Agricultural Resource Management Survey (ARMS) to assess how ARC-County and PLC payment were distributed in 2015, when payments from both programs were triggered by agricultural market downturns. Next, I looked at how these payments differed across the farm sales distribution to determine whether there were differences in how much operations received based on the size of their gross revenues. I focused on the three largest crops produced in the United States: corn, soybeans, and wheat.
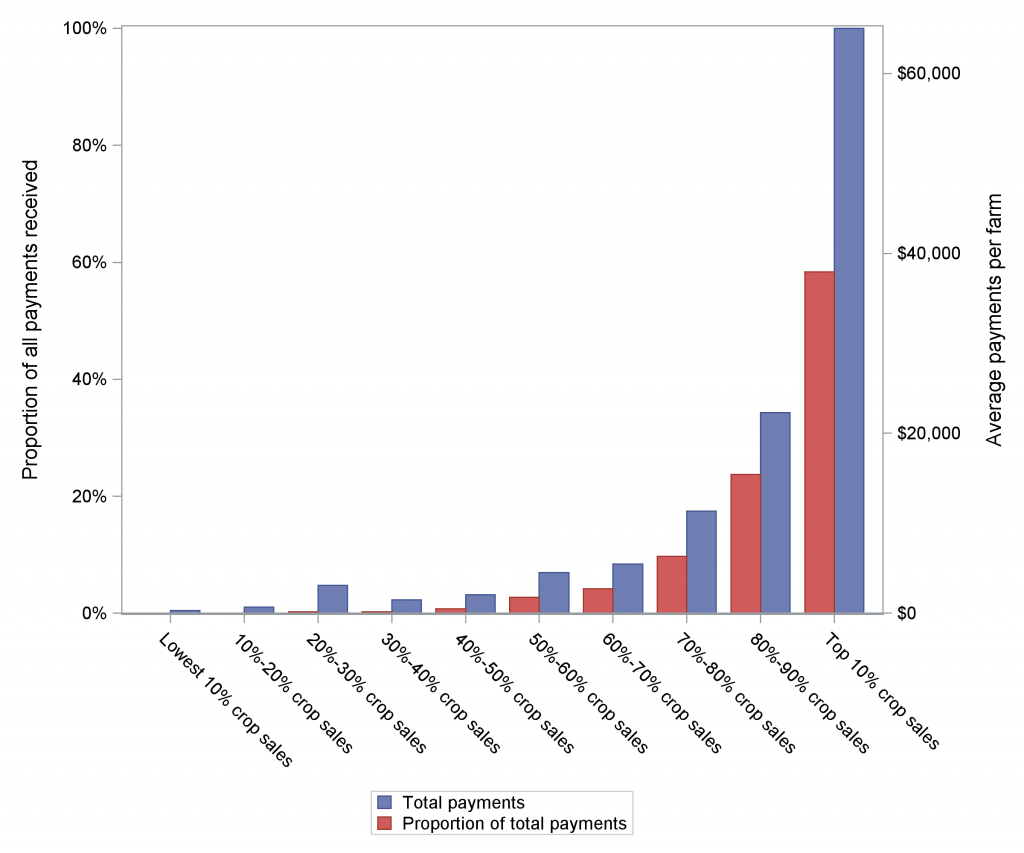
Figure 1 shows the per farm average payment to operations across the farm sales distribution. The figure shows that, on average, farms that earned the median amount of gross revenues from farm sales received approximately $4,000 per farm in total ARC and PLC payments in 2015. However, farms that were in the top 10% of farm sales received, on average, approximately $65,000 per farm in program payments. Farms in the lowest 10% of farm sales received just under $300 per farm.
Figure 1: Per Farm ARC+PLC Payments in 2015, by Farm Sales Decile
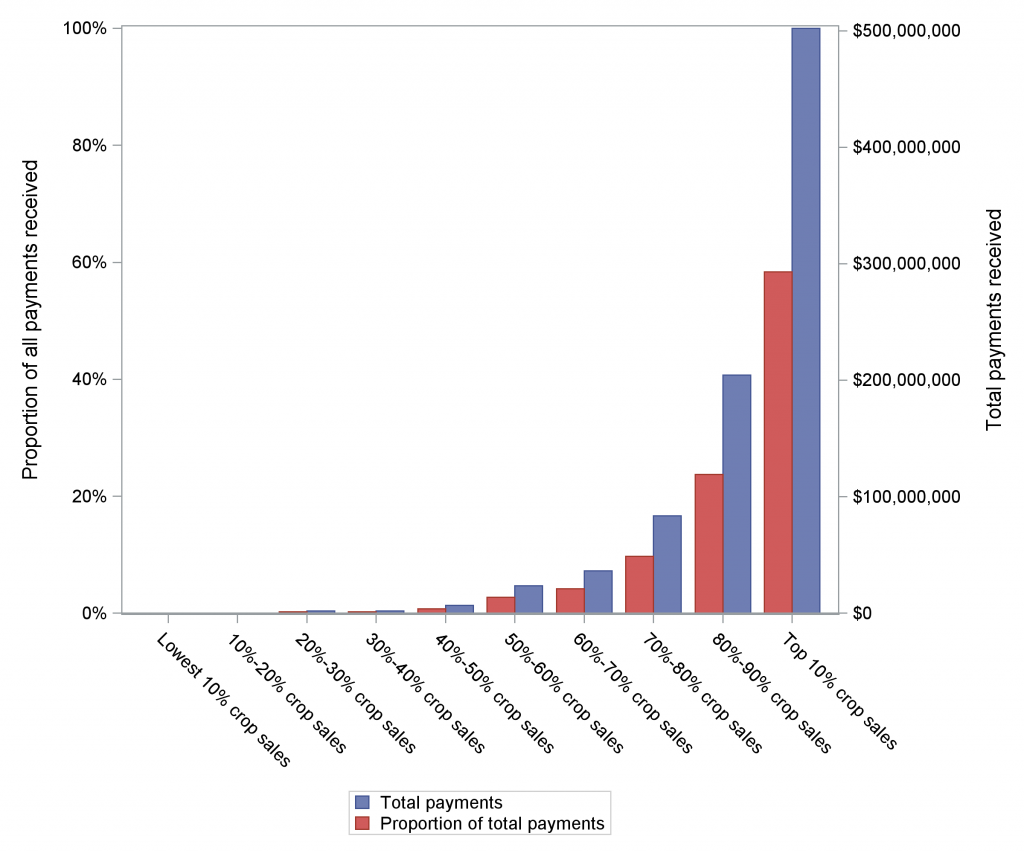
Figure 2 shows the total payments received by farms across the gross revenue distribution. The figure shows that farms that were in the top 10% of the farm sales distribution received, in total, approximately $500 million in ARC and PLC program payments. This represents 58% of all program payments. Farms that had the median amount of farm sales collected approximately $23 million in program payments, representing about 3% of total outlays.
Figure 2: Total ARC+PLC Payments in 2015, by Farm Sales Decile
As discussions about the 2018 Farm Bill are beginning to take place and the future of farm program structures are considered, using data-driven approaches to evaluate existing safety net programs are key to understanding whether these programs are efficient, effective, and equitable, and whether changes are needed to attain those goals.


