Last month I compared crop insurance coverage choices in Montana and the Midwest, specifically, Illinois, in response to this farmdoc post. To summarize, Montana producers generally choose less coverage than Illinois producers. Montana producers also generally pay less in average premiums, but that doesn’t take into account coverage levels or liability. This month we dive a little deeper by comparing premium to liability ratios. (In other words, we are comparing the ratio of insurance cost to what it’s actually covering.)
Again, we’re not able to make a direct comparison. Production systems in Montana are very different from those of the Midwest. Instead, we compare Revenue Protection (RP) wheat policies in Montana with RP corn policies in Illinois. And, we’re looking at producer-paid premiums, or premiums after government subsidies have been taken into account.
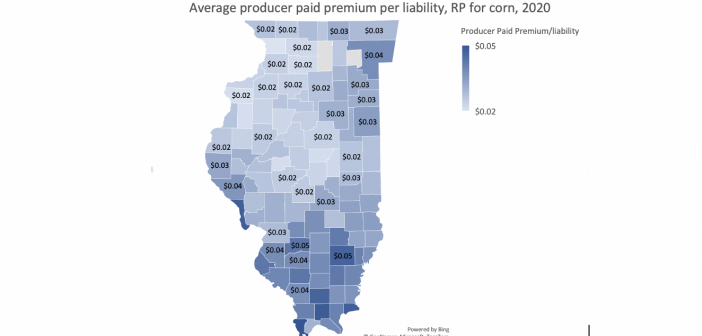
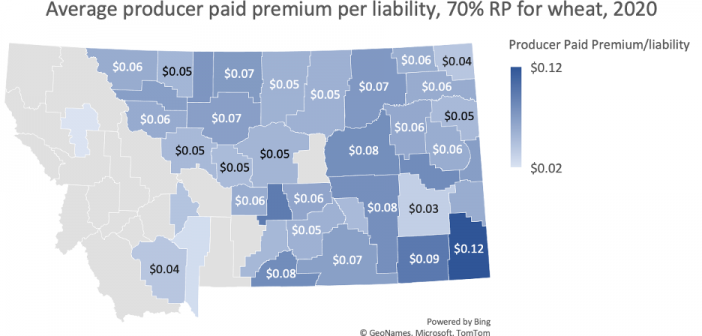
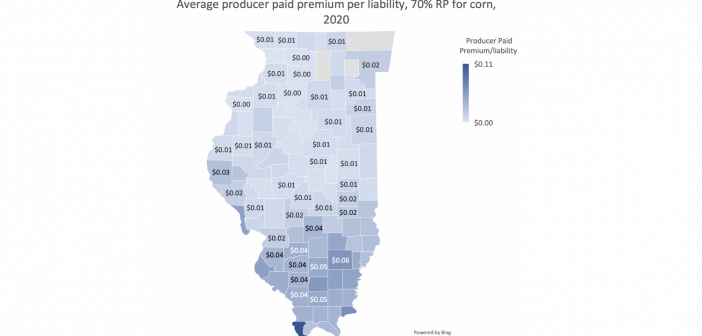
On average, Montana producers pay more per dollar of coverage than producers in Illinois. (See above for Montana map, and below for Illinois map):
This is also true looking at specific coverage levels. At Montana’s most popular coverage level (70%, below), producers pay between $2.00 and $12.00 per $100 of coverage, with most counties averaging between $5 and $7.

In Illinois, producers pay between less than $1.00 and $11.00 per $100 of coverage, but most counties average between $1 and $2 for 70% coverage.

It is a bit trickier to compare these ratios for Illinois’ most common coverage level (85%) simply because there are so few 85% policies sold in Montana. But counties where data are available, the story is similar. These policies are more expensive per unit of coverage in Montana than Illinois.
So, why is this the case? While it looks like Montana producers pay more for the same product, there are important differences that aren’t obvious from what we’ve looked at so far. At the same level of coverage in Montana, policies are likely more likely to trigger a payment – at least that is what a lot of historical data suggest. The West has seen more severe, devastating drought during the history that is taken into account when rating these policies. And Montana has relatively few irrigated acres compared to other parts of the country—so droughts hit harder.
How these policies have paid over time will likely be the subject of a future post.
This article was written with assistance from MSU DAEE MS student Hannah Wing. Except where noted or linked, the data in this piece all come from the RMA Summary of Business Report Generator.

