Last month,the University of Illinois farmdoc team posted about crop insurance coverage selection in relation to premiums. Their analysis, which is for Illinois and the Midwest, had me thinking because I often get questions about whether and why Montana crop insurance choices differ from the Midwest. (As an aside, these fall into a common, broader bin of questions I receive on how and why Montana ag is unique.)
So, how does Montana differ from the Midwest in crop insurance selection? Well, in general, Montana producers purchase less insurance. While the probability of a commodity crop acre being insured is roughly the same in Montana as the rest of the country, producers here are more likely to select policies and coverage levels with, well, less coverage. In contrast to the Midwest where revenue protection (RP) policies have become overwhelmingly popular, yield protection (YP) maintains a strong foothold in Montana. Over 20% (23% in 2020) of insured acres in Montana use YP.
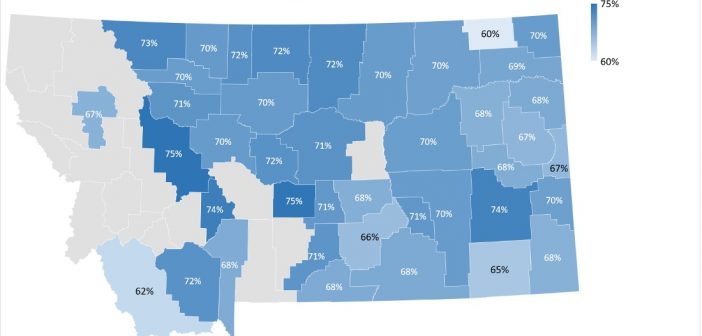
Selecting YP rather than RP is one way producers insure less. YP does not cover price changes during the growing season as RP can. Another way is in coverage level. Within RP policies, producers in the Midwest are more likely to max out coverage, in comparison to Montana producers who are most likely (by far!) to select 70% RP coverage. (Click on chart above for full detail.) That varies a little from county to county (see below), but generally not much.

Some of the comparison to the farmdoc article isn’t exactly direct, in part because Montana generally grows different things than the Midwest does. We have relatively few corn acres here and almost no soybean acres. (The farmdoc article focuses on corn, but I’m focusing on wheat.)
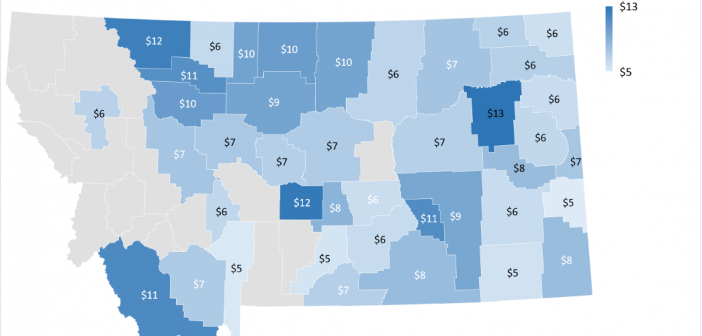
So, why do Montana farmers purchase less insurance? Well, that’s the next question, and I won’t really answer it today. The farmdoc article explores the coverage levels chosen in relation to premiums and we do that as well, below. The average producer-paid premiums (after federal subsidy) appear slightly to much lower in Montana than those in Illinois in per acre terms. That’s unsurprising given that average coverage levels are higher in Illinois…and given that the liability (or amount of revenue actually insured) is generally higher per acre in Illinois as well.

Another contributing factor to these regional differences may also be the risk that the ratings capture. The western US has a history of severe drought and the data used to rate insurance reaches far into history. While recent years have actually been relatively mild compared to some of the multi-year droughts in at least Montana’s history, those droughts still show up and play a role in RMA’s rating. Future work will look at how premiums compare to dollars of revenue insured.
References:
Schnitkey, G., N. Paulson, C. Zulauf and K. Swanson. “Coverage Levels on RP: Relationship to Premium Levels.” farmdoc daily (10):206, Department of Agricultural and Consumer Economics, University of Illinois at Urbana-Champaign, December 1, 2020.
This article was written with assistance from MSU DAEE MS student Rebecca Kaiser. Except where noted or linked, the data in this piece all come from the RMA Summary of Business Report Generator.

