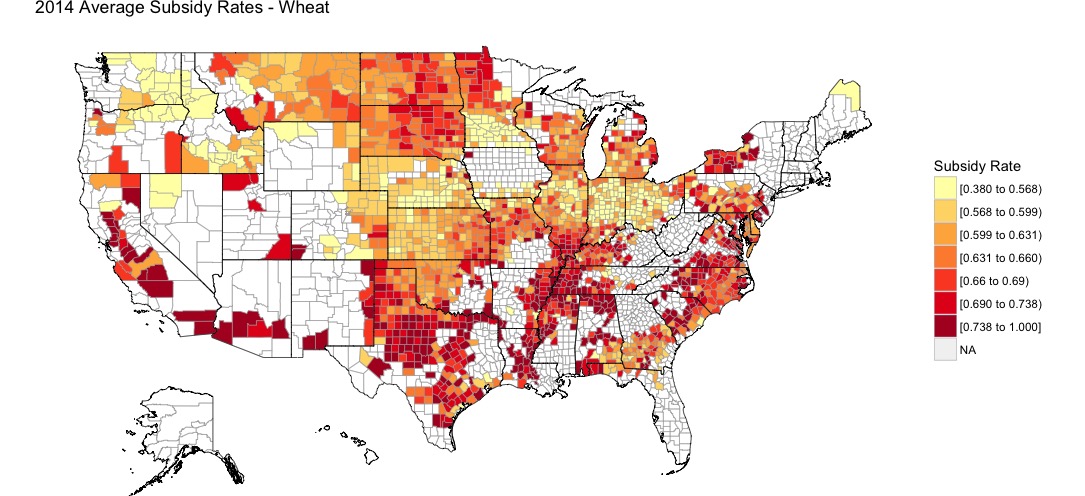
With the next farm bill planned to be completed by 2018, there are many ideas for dealing with anticipated budget cuts while preserving a solid safety net for farmers and ranchers. One such plan was proposed in 2015, was the Assisting Family Farmers through Insurance Reform Measures Act, also known as the AFFIRM Act, which was proposed in the U.S. Senate by Jeff Flake (R-AZ) and Jeanne Shaheen (D-NH) as well as in the U.S. House of Representatives by Jim Sensenbrenner (R-WI) and Ron Kind (D-WI). One of the provisions in this bill was to limit premium subsidies from federal insurance programs to $40,000 per farm. The Risk Management Agency (RMA) rates insurance products according to the total premium, then the subsidies effectively reduce the farmer-paid premium rate. Nationally, the average subsidy rate is around 62%. Below is a figure with the average effective subsidy rate for wheat insurance products, by county, based on data from the RMA. Notice that lower subsidy rates, particularly in the Midwest region, are due to higher coverage levels selections.

To evaluate the impact of the proposed subsidy cap, data from the 2014 Agricultural Resource Management Survey (ARMS) are used. The ARMS data is a great resource for policy analysis as it provides farm-level data that includes the amount of crop insurance expenses each farm incurs, as well as other production and financial indicators. Based on crop insurance expenses, and correcting for regional differences in coverage level selections and subsidy rates, the amount each farm receives in premium subsidies can be estimated. This ultimately allows for an analysis into the impact of a cap on premium subsidies.
I estimate that a $40,000 premium subsidy cap would impact 5.23 percent of all farms and result in a reduction in premium subsidies paid to farmers by $2.06 Billion per year. This amount is 36% of the approximately $5 Billion in total premium subsidies in 2014.
Another important consideration for this program is regarding which crops will be impacted. The burden of this program would be spread as shown in the figure below. Around 21% of the savings from this program would come from reduction in subsidies to wheat producers, while corn and soybean producers account for 61% of the total reductions.

Finally, there are a few caveats and implementation issues. Most importantly, this analysis looked at decisions made in 2014, which would be different if the cap were actually imposed that year. For example, farms may reduce insured acres, reduce coverage levels, or split farm operations to avoid hitting the subsidy cap. The policy does raise an interesting question regarding whether the concentration of farm payments to relatively large farms is appropriate, in spite of agricultural production having a similar concentration ratio. One thing is for sure: There will be plenty of policy options to discuss in future posts over the next couple of years.

