Key insights:
- After India imposed significant tariffs on pea, lentil, and chickpea imports in late-2017, pulse markets have weakened.
- Canadian pulse inventories are expected to rise significantly relative to the previous year, putting downward pressure on prices in North American markets.
- Price ratios of pulse crops relative to hard red spring wheat have dropped, indicating increasing value of wheat.
Pulse markets have significantly grown in eastern Montana and northwestern North Dakota. A substantial proportion of that growth was a result of strong export markets, especially India. Between 2007 and 2016, India accounted for 47% of the value of U.S. dry pea exports,17% of lentil exports, and 13% of chickpea exports (USDA Foreign Agricultural Service). In late-2017, however, the Indian market all but closed to North American exporters as a result of 50% import tariffs imposed on peas on November 8 and 30% tariffs on lentils and chickpeas on December 21. While rumors of such tariffs circulated throughout late-summer and early-fall, the timing of their announcement and enforcement came as a surprise.
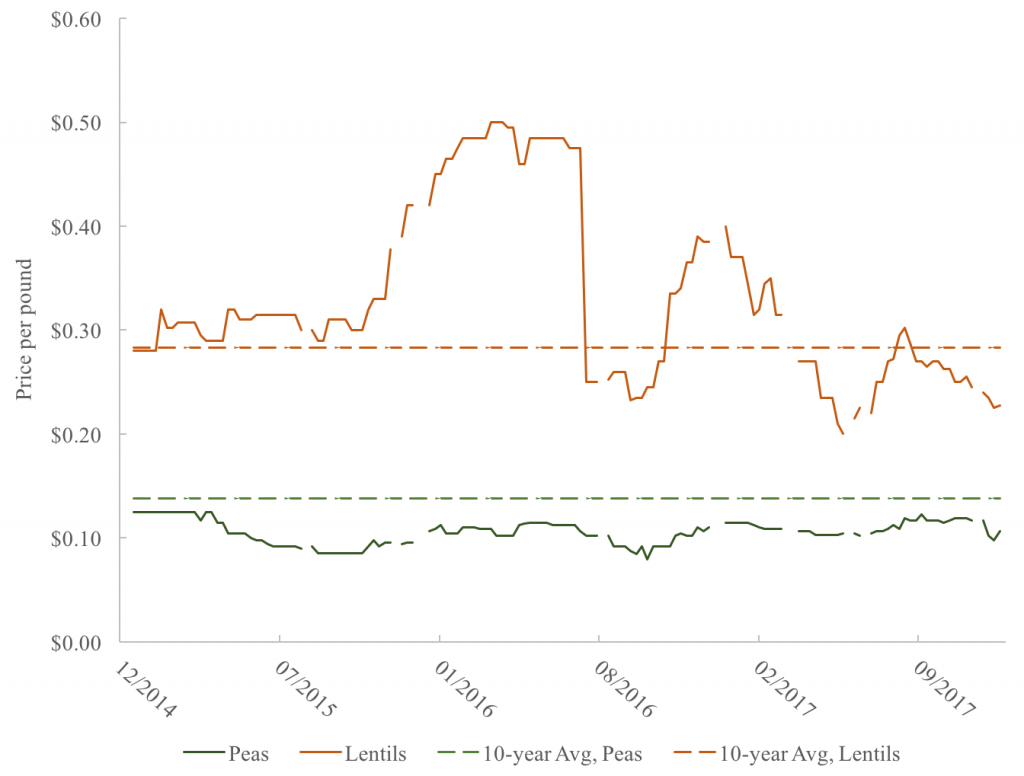
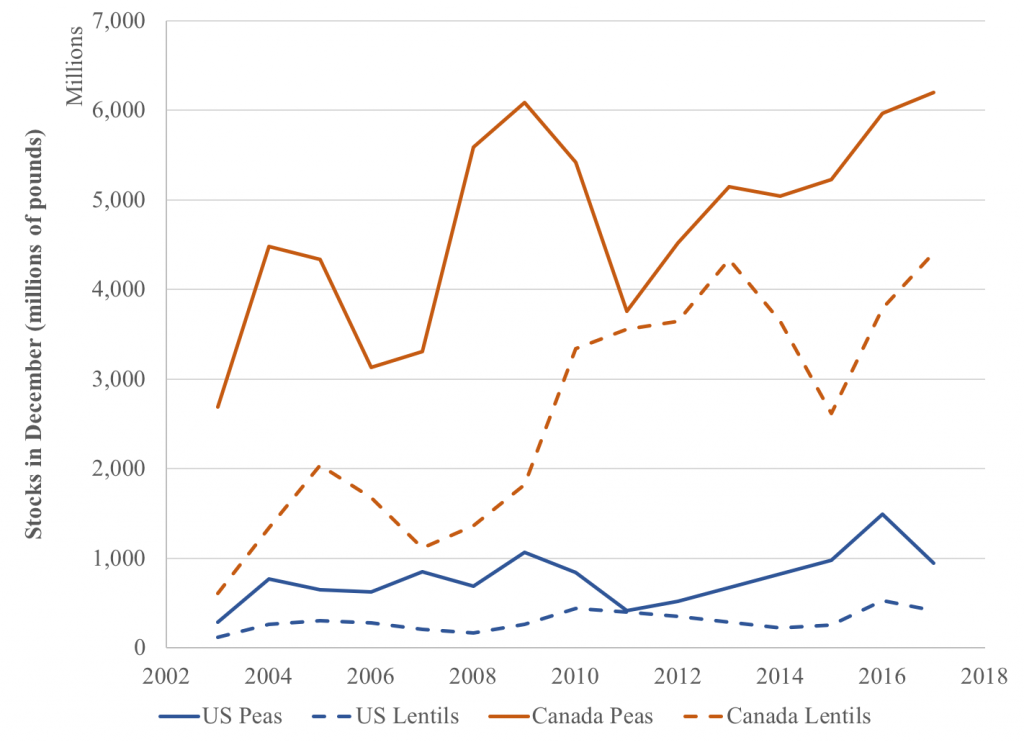
As a result of essentially losing the largest buyer of North American pulse crops, prices of peas, lentils, and chickpeas have dropped and may remain stagnant at those levels in the short-run as a result of higher inventories. The figures below show pea and lentil prices in the northeast Montana / northwest North Dakota region as well as inventories in the United States and Canada. The first figure shows that both pea and lentil prices were at or near their 10-year average around the 2017 harvest, but have since trended downward due to both higher Canadian output and Indian import policies.
The second figure shows that Canadian pea and lentil stocks have trended upward over the past two years. Inventories in the United States have dipped since last year (largely as a result of 35-60% production losses resulting from the intense drought in the northern U.S. during summer 2017), but still remain high relative to the stocks in the last decade.
The table below shows the most recent projections of Canadian stocks-to-use ratios (which measure the available inventories relative to consumption), which indicate that current inventories are not likely to be drawn down quickly over the next year. This is due to the combination of higher Canadian production in 2017 (in response to lower 2016 stocks-to-use) and anticipated strong Indian demand (before the unexpected tariffs in late 2017). The stocks-to-use ratios are projected to remain relatively high in 2018/19 as a result of carryover from the 2017/18 stocks and an anticipated continuation of weaker Indian demand.
| Marketing Year | |||
| Crop | 2016/17 | 2017/18 | 2018/19 |
| Peas | 0.06 | 0.37 | 0.29 |
| Lentils | 0.13 | 0.53 | 0.44 |
| Chickpeas | 0.01 | 0.18 | 0.18 |
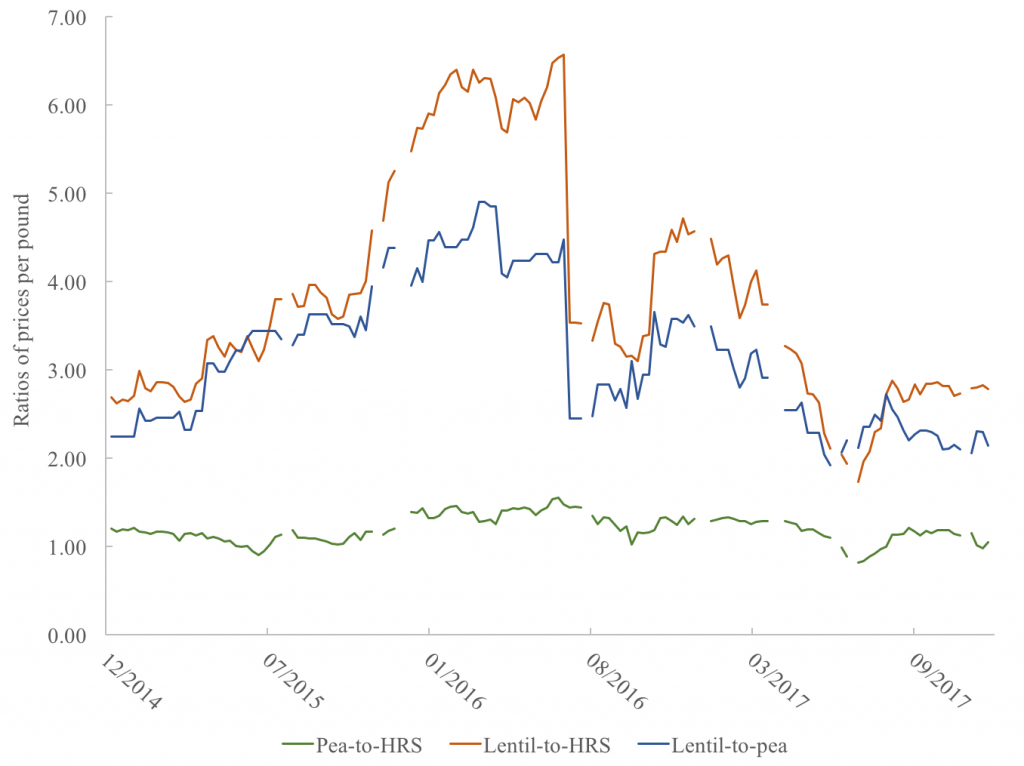
When considering 2018 planting decisions, one instrument for helping with those decisions is considering price ratios of competing crops that can be seeded. An increase in the price of one crop relative to another would be a signal of a potentially higher return to producing that crop relative to an alternative. The figure below presents these price ratios of pea-to-spring wheat, lentil-to-spring wheat, and lentil-to-pea. Relative to spring wheat, peas have maintained a fairly similar value over the past several years. However, the value of lentils to spring wheat has receded to 2014 levels, with relatively sideways movement in late 2017 and early 2018. However, the value of lentils relative to peas has been trending downward since its peak in 2016.
Keeping a close eye on price indicators, stocks-to-use projections, any potential good news from Indian markets, among other factors will be critical in making production decisions in 2018. What are your go-to instruments for making these decisions?


1 Comment
Pingback: How Far Does Montana Grain Travel from the Farm? | Northern AG Network