A few months back, I discussed the 2018 farm bill and the fact that the ARC-Individual (ARC-IC) option introduced in 2014 remains a part of the legislation. Now that the 2014 bill is essentially over, I’ve been wondering how ARC-IC stacked up to the other Farm Bill programs, ARC-County (ARC-CO), and PLC.
Details on ARC-CO and PLC are available here, and I gave a recap in my previous post, so I won’t do so here. ARC-Individual (ARC-IC) is a version of ARC-CO in which calculations are based on individual farm production records, rather than county averages. ARC-IC was something that Montana producers advocated for in the 2014 bill. The creation of ARC-IC was prompted by concern that county average yields might not reflect situations on individual farms, especially in large counties. ARC-IC is based on actual farm production rather than historical base acres and county average production. However, ARC-IC pays on 65% of total base acreage, rather than 85%, as in the cases of ARC-CO and PLC.
So how did ARC-IC measure up to the other two programs?
I’ve been combing through some Farm Service Agency data from the last farm bill. Because these data come from a Freedom of Information Act (FOIA) request, I can see data on actual payments. That means I can’t see when a producer signed up for a program but did not receive anything. Because of that and other variables I can’t observe, it is difficult to say which program would have benefited which farm the most. But we can look at the payments that actually were made and the programs they were made under.
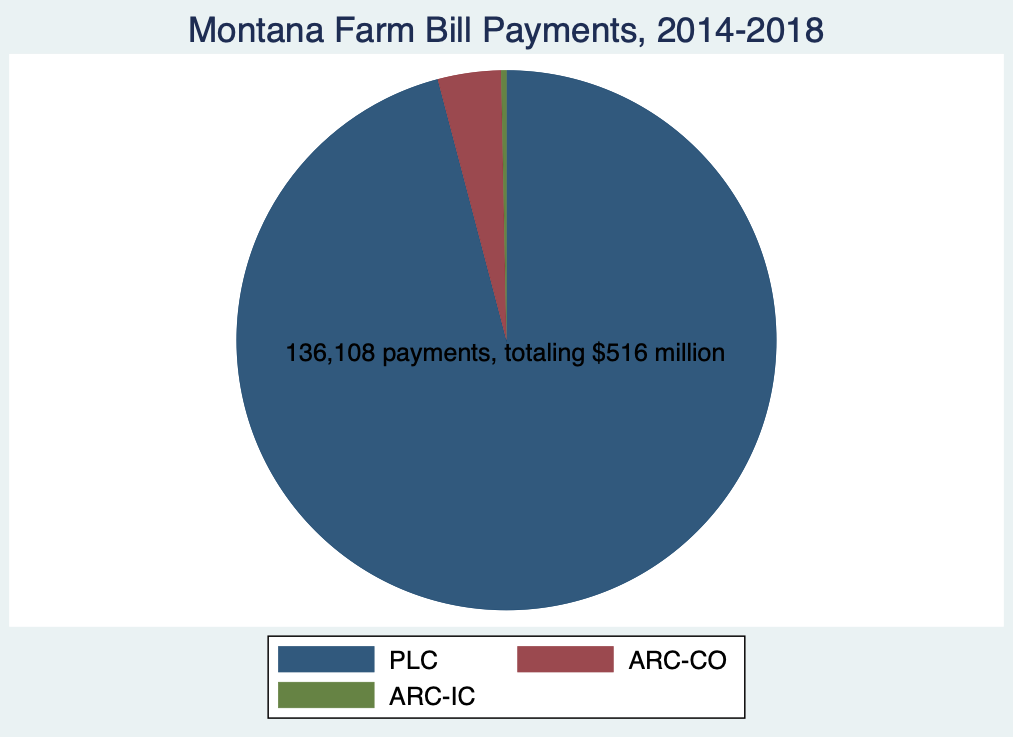
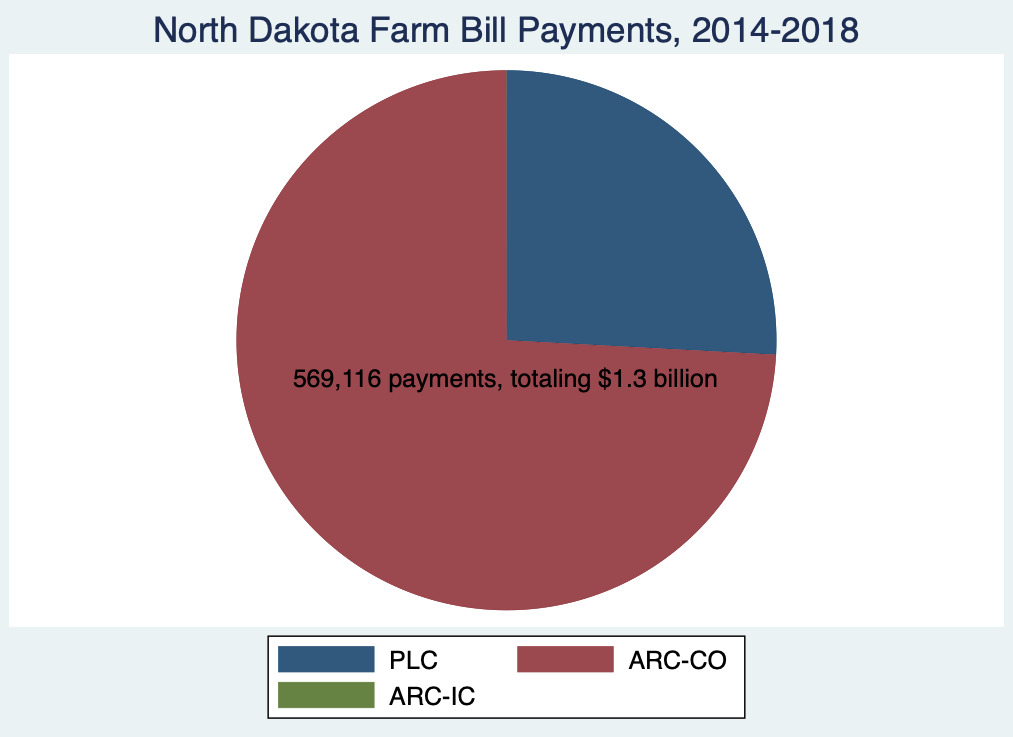
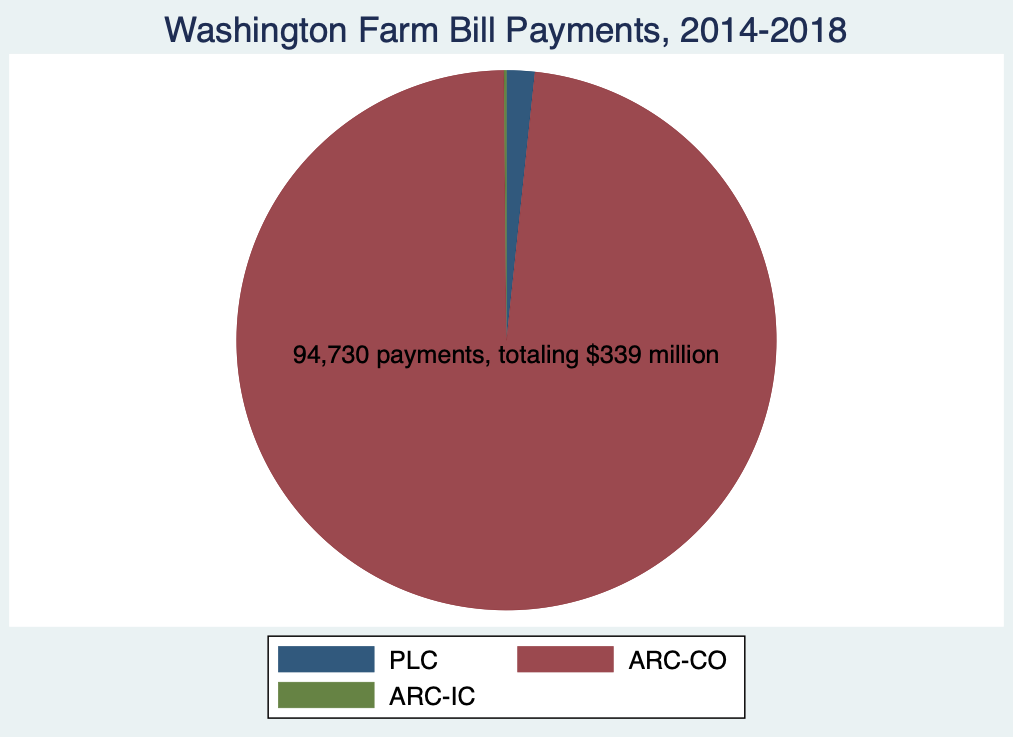
Unsurprisingly, given the advocacy for the program here, Montana has the most observations of ARC-IC payments as well as the most total payments. Montana had 5,285 ARC-IC payments over the five year bill, totaling $27.6 million. Nearby North Dakota (3,296 ARC-IC payments totaling $11.0 million) and Washington State (3,131 ARC-IC payments totaling $11.6 million) were the runners up for ARC-IC participation. But, both the number of payments and total dollars sent out under ARC-IC are very much dwarfed by ARC-CO and PLC, for all three states.


The charts above show farm bill payments for the three states. Aside from (relatively) larger amounts of election of ARC-IC, they appear dramatically different. Montana overwhelmingly chose PLC, North Dakota largely chose ARC-CO, and Washington farms almost exclusively selected ARC-CO. Differences could be due to variation in crops planted and base acreage, weather and other production conditions. They could also be due to differences in what programs producers elected, potentially a function of forecasts of prices, yields and other factors.
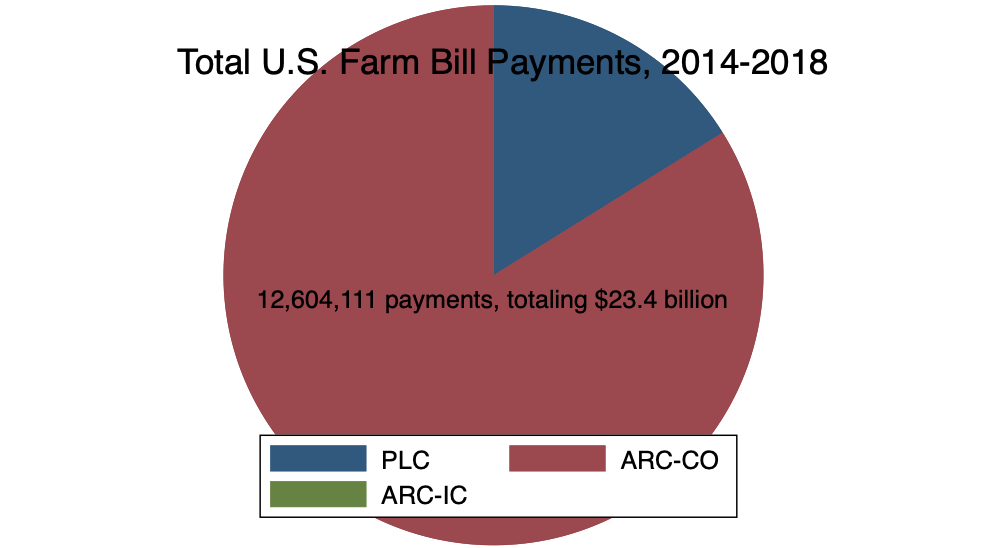
Over the U.S. as a whole (see above), approximately $23.4 billion was paid out for these three programs over the farm bill. The projected outlay for these programs was originally approximately $24.5 billion–so relatively close. (If you’re interested, FarmDoc has a good overview of farm bill projections and actual spending here.)
Thoughts? Suggestions for other ideas to look at with these data? Send them my way.

