Prices in agricultural markets are lower than several years ago. This is likely not new information to anyone. Cattle prices were at recent highs in 2014 while wheat markets were at recent highs in 2012. Prices and financial success in agriculture are related but are not the same. Input costs, yields, government program payments and other factors beyond prices are also important to the Ag sector’s financial success. Financial ratios are one way to look at the “financial health” of a sector. USDA’s economic research service reports a variety of interesting charts which can be found here. Here are few highlights from USDA’s data.
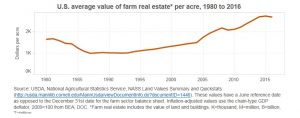
Often much of a farm operation’s wealth is comprised of real estate. The chart below shows that average U.S. farm real estate prices leveled off and slightly declined over the past three years. This follows fairly consistent real estate price increases since 1987. The lack of significant real estate price declines indicates the average farm should not be seeing negative financial pressure from changing real estate prices. This is a very different situation from the early to mid-1980s when farm real estate prices declined by roughly one-third which put significant financial pressure on many Ag operations. In Montana, farm real estate increased in value by 1.1% in 2016.

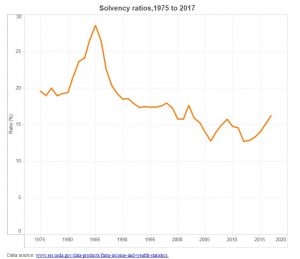
A more important ratio is an operation’s solvency ratio. This ratio is common calculated as total debt divided by equity. As indicated in the chart below, the solvency ratios for the Ag sector have been rising since 2012. The solvency ratio for US Ag operations is at its’ highest level since 2003. However, this level is below the those seen in the 1990s and substantially lower than the peak levels seen in the mid-1980s. This recent increase does suggest the balance sheets for many Ag operations have been worsening in recent years.

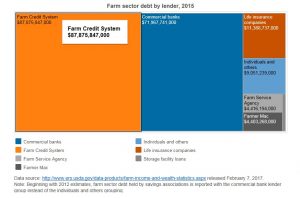
A final chart that caught my eye as I read the USDA report was the summary of lenders operating in the ag sector. As the solvency ratio increases is puts pressure on these agricultural lenders. The chart below provides a national level look at the different types of agricultural lenders and their total volume of loans. The largest lender is the Farm Credit System (47%), followed by Commercial Banks (38%), Insurance Companies (6%), Individuals & Other Lenders (5%), Farm Service Agency (2%) and Farmer Mac (2%).

The take home message from this data is that the Ag sector’s financial health has been declining in recent years. However, the sector remains in a relatively good overall financial health because of the strong financial position the sector was in prior to the decline and because up to this point the declines have been relatively modest.

