I recently posted about the premiums that can be expected for protein level differences in 2016. In the post, I mentioned one of my recent academic journal publication, “Forecasting a Moving Target: The Roles of Quality and Timing in Determining Northern U.S. Wheat Basis.” In this research project, I, along with two other colleagues, wanted to use historical wheat basis (the difference between a cash and futures price) to develop economic models that would help (a) better understand market forces that affect prices of wheat in the northern Great Plains around harvest and (b) better forecast those prices.
Without going into too much detail about the modeling aspects, we considered 52 different models of historical hard red winter and hard red spring wheat prices. Here is what we found:
- For hard red winter wheat, the model that best explained and predicted wheat basis asked about 8 market factors:
- What was last year’s basis value on this day?
- What is the current July futures price?
- How volatile have futures prices been in the past week?
- What is the difference in the price of a September spring wheat futures contract and the July winter wheat futures contract?
- What is the protein level of the wheat you’re marketing?
- Where is the location of the elevator to where you’re delivering your wheat?
- What week of the year is it on this day?
- For hard red spring wheat, the model indicated that all questions above were relevant except, “How volatile have futures prices been?”
- Elevators in the northern U.S. (we used daily data from 215 elevators across Montana, North Dakota, and Washington) follow a relatively linear pattern when offering premiums or discounts for protein level differences in hard red spring wheat. Assuming a 14% protein level as a standard:
- 12% protein level spring wheat is, on average, associated with a $0.73 per bushel discount.
- 13% protein level spring wheat is, on average, associated with a $0.43 per bushel discount.
- 15% protein level spring wheat is, on average, associated with a $0.35 per bushel premium.
- 16% protein level spring wheat is, on average, associated with a $0.54 per bushel premium.
- However, for hard red winter wheat, discounts for lower-than-standard protein levels were sharper than premiums. Assuming an 11.5% protein level as a standard:
- 10% protein level winter wheat is, on average, associated with a $0.33 per bushel discount.
- 11% protein level winter wheat is, on average, associated with a $0.19 per bushel discount.
- 12% protein level winter wheat is, on average, associated with a $0.10 per bushel premium.
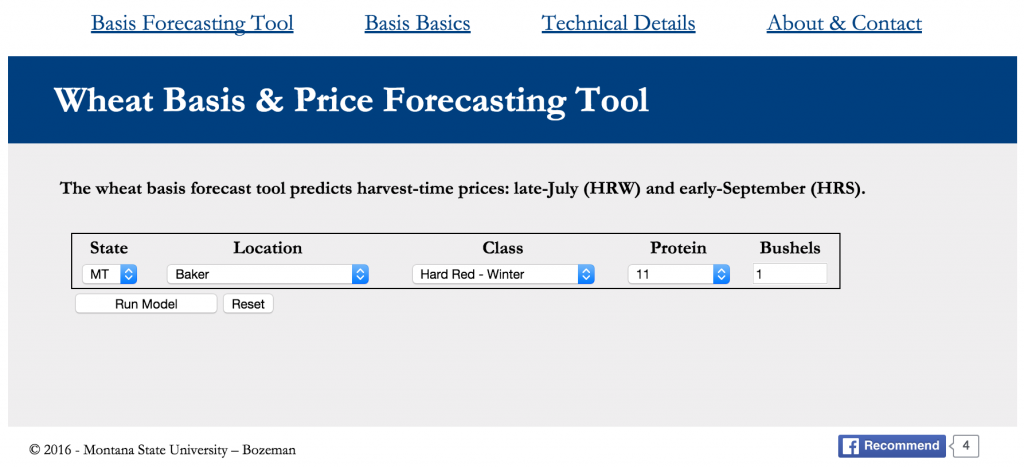
In addition to better understanding the wheat marketing landscape in the northern United States, we used these findings to put together an interactive, web-based tool that can be used to forecast wheat basis based on the wheat class, wheat protein level, and delivery location. You can access the tool here: http://wheatbasis.montana.edu and here’s a snapshot of what it looks like.
The neat part about that tool is that it updates on a daily basis to incorporate current market conditions and provide the most up-to-date price forecast!
(Image from CMEGroup, Inc.)


