Every decade the census attempts to count everyone in the country. Many government programs utilize population as a component of how resources are distributed. Areas that are under counted are at risk of not receiving their fair share of these resources. Legislative districts at both the state and national level are based on these population estimates. Several different organizations that track and attempt to predict which states will gain or lose congressional seats are predicting that Montana will gain a second electoral seat based on the 2020 Census. They are also predicting that Montana will be the last state to receive an additional seat. Election Data Services is predicting the margin could be between 2,500 and 4,100 people. This is a very thin margin. A low response rate to the 2020 Census in Montana could under count Montana’s population and thus prevent Montana from gaining an additional congressional seat.
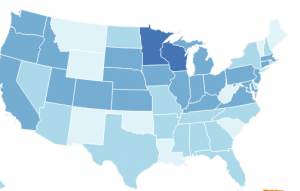
How are Montanans doing at completing their census forms? The short answer is not very well. The current self-response rate is 56.1% for Montana. This places Montana in the bottom 10 states nationwide. The national average is currently over 62%. The chart below indicates the response rates across the country. Darker colors indicate higher response rates. The information is being updated regularly and can be accessed here.

Montana legislative districts are also based on population data provided by the census. Each legislative district represents roughly an equal number of Montanans at the time the districts are reapportioned. Ten years later the process is repeated to reflect population changes in Montana. From 2010 to 2019 Montana’s population grew by 7.9%. Each Montana House of Representatives member represented approximately 9,900 Montanans in 2010. Each representative will represent approximately 10,700 Montanans (based on 2019 data) due to overall population growth in Montana. Any area that lost population or grew at less than the statewide growth rate will effectively lose representation in the Montana legislature while areas that grew faster will gain representation. Comparing the 2010 census to the 2019 American Community Survey (ACS) population estimates, 24 counties lost population and 21 others grew at less than the statewide average. Four counties (Toole, Prairie, Phillips and Golden Valley) lost more than 5% of their population over this period. Eleven counties grew at a rate greater than the statewide average. Gallatin (28%), Flathead (14%), Madison (12%), Broadwater (11%) and Richland (11%) all had growth exceeding 10%. Four counties accounted for over 75% of the statewide population growth. Gallatin (24,780), Flathead (12,942), Yellowstone (12,906) and Missoula (10,133) will all gain significant representation in the Montana Legislature.
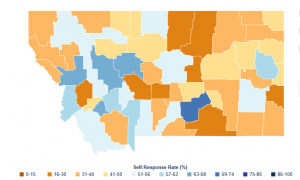
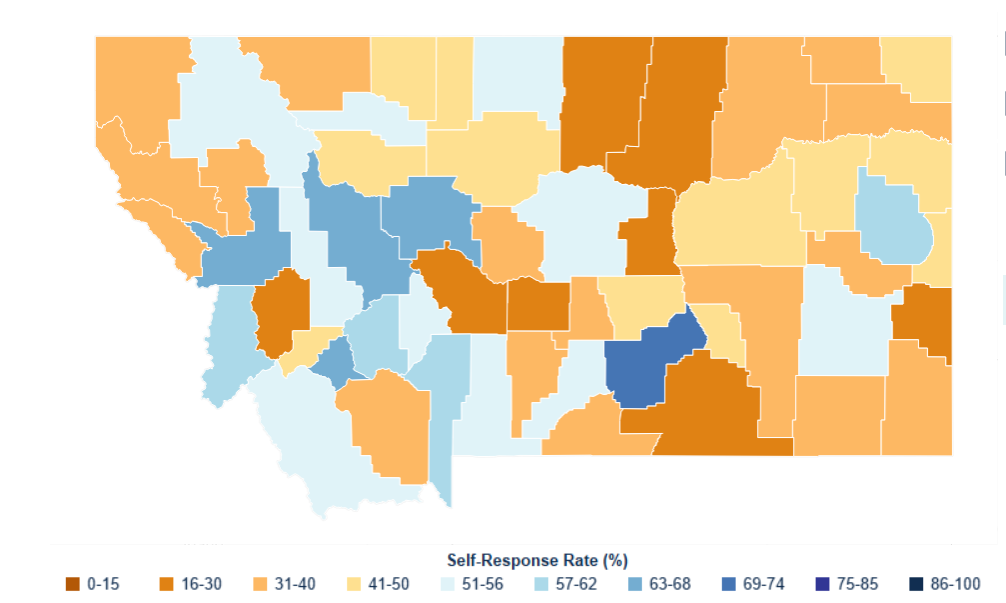
All of the numbers provided above are based on the 2019 ACS data so the 2020 Census will not only include an extra year of data but it will also have a much smaller margin of error than the ACS survey data. The map below shows the 2020 census response rates by county in Montana. Yellowstone, Silver Bow, Missoula, Cascade and Lewis and Clark have the highest response rates while Blaine, Phillips, Fallon, Petroleum, Wheatland, Meagher, Big Horn and Granite have the lowest response rates. The 2020 Census could have some very big impacts for Montana. There is still time for Montanans to complete the 2020 census if they have not yet do so.


